Examples
Five example diagrams showing what drawmode can produce. Each includes the TypeScript source code and the rendered output.
Microservices Architecture
Section titled “Microservices Architecture”A typical microservices setup with an API gateway routing to backend services, each with its own data store. Uses groups to visually separate service and data layers.
const d = new Diagram();const users = d.addBox("Users", { row: 0, col: 1, color: "users" });const gateway = d.addBox("API Gateway", { row: 1, col: 1, color: "orchestration" });const auth = d.addBox("Auth Service", { row: 2, col: 0, color: "backend" });const orders = d.addBox("Order Service", { row: 2, col: 1, color: "backend" });const payments = d.addBox("Payment Service", { row: 2, col: 2, color: "backend" });const redis = d.addBox("Redis", { row: 3, col: 0, color: "cache" });const postgres = d.addBox("Postgres", { row: 3, col: 1, color: "database" });const stripe = d.addBox("Stripe API", { row: 3, col: 2, color: "external" });
d.connect(users, gateway, "requests");d.connect(gateway, auth, "authenticate");d.connect(gateway, orders, "place order");d.connect(gateway, payments, "charge");d.connect(auth, redis, "sessions");d.connect(orders, postgres, "queries");d.connect(payments, stripe, "payments");
d.addGroup("Services", [auth, orders, payments]);d.addGroup("Data Stores", [redis, postgres, stripe]);
return d.render();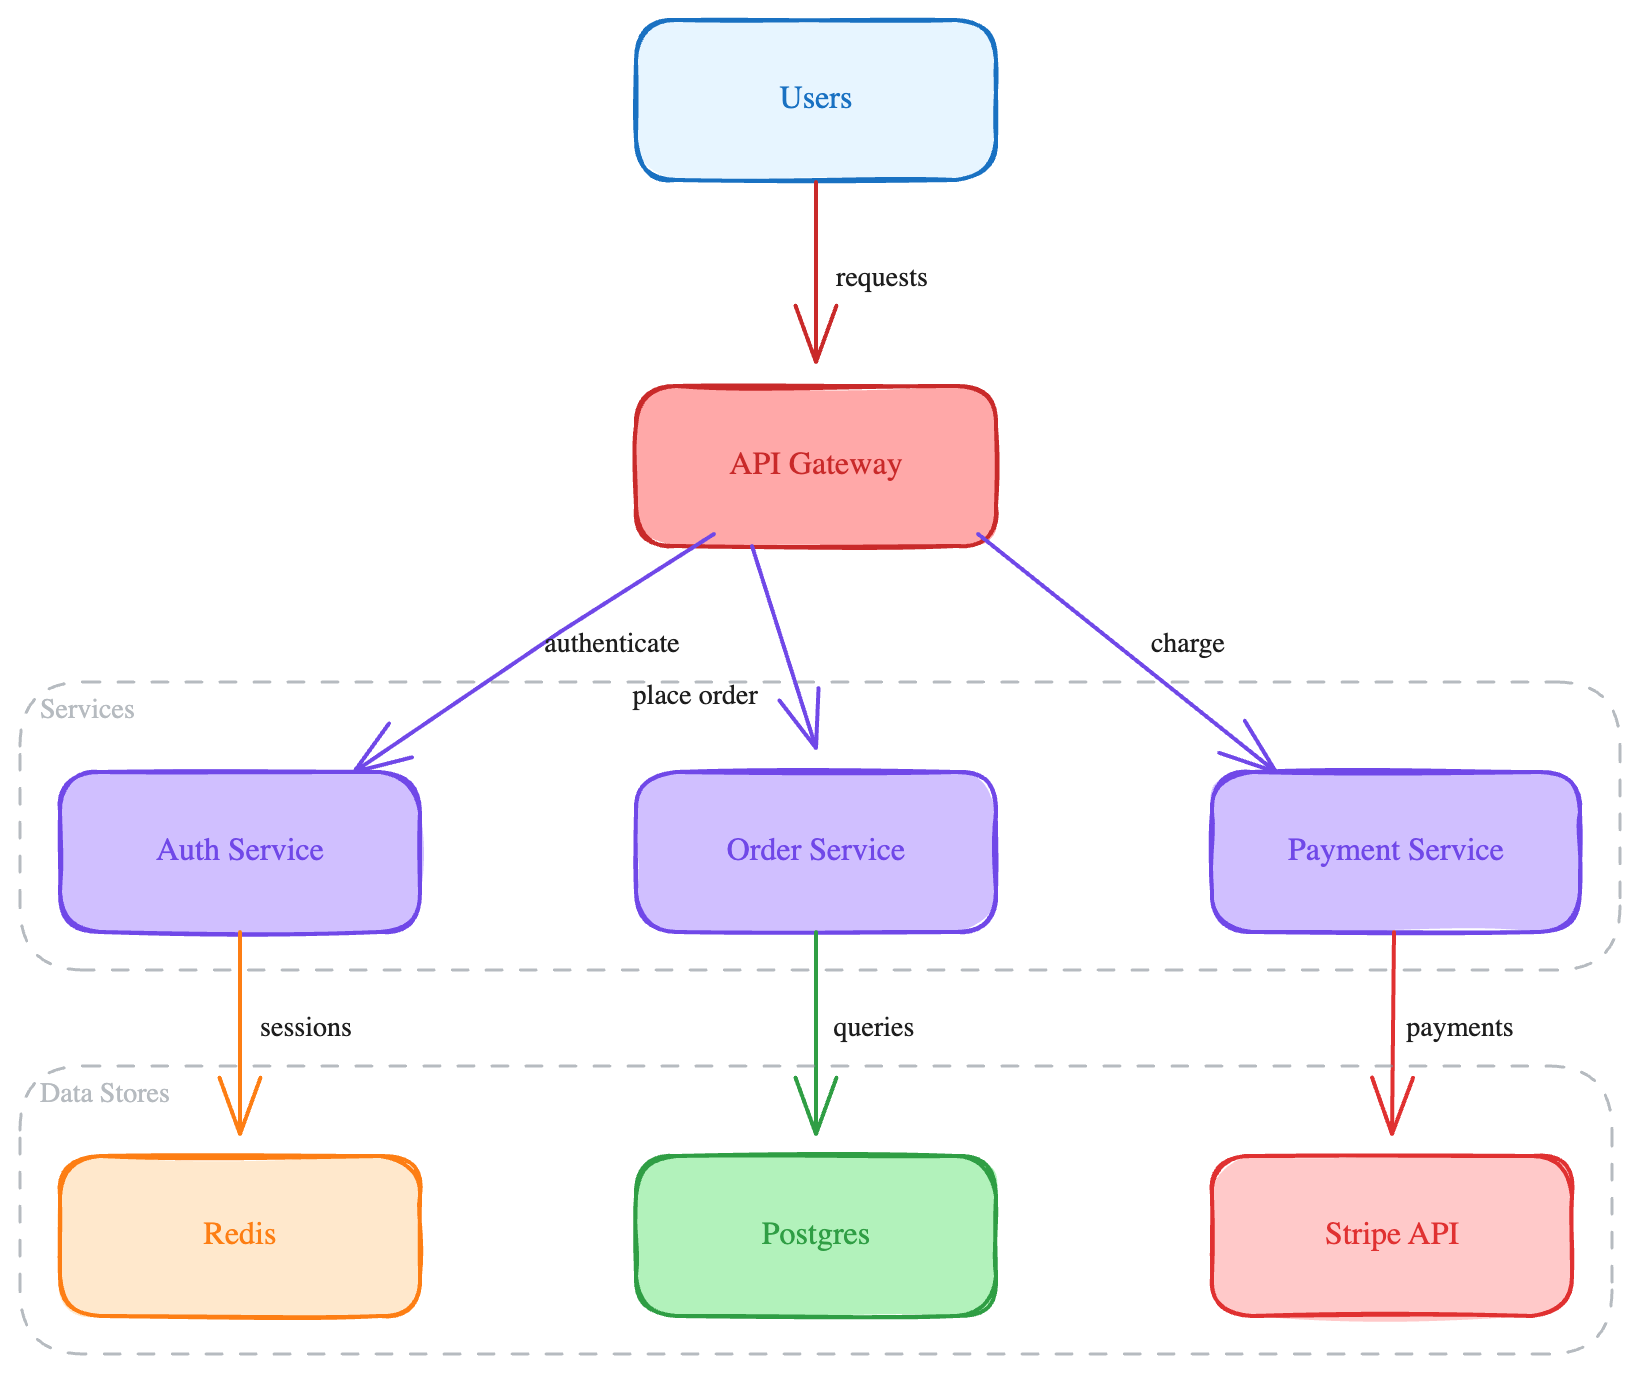
AWS Infrastructure
Section titled “AWS Infrastructure”An AWS deployment with Route 53, ALB, ECS services, RDS, and S3 — using the aws-* color presets. The VPC group wraps the internal resources.
const d = new Diagram();const route53 = d.addBox("Route 53", { row: 0, col: 1, color: "aws-network" });const alb = d.addBox("ALB", { row: 1, col: 1, color: "aws-network" });const ecs1 = d.addBox("ECS Service A", { row: 2, col: 0, color: "aws-compute" });const ecs2 = d.addBox("ECS Service B", { row: 2, col: 2, color: "aws-compute" });const rds = d.addBox("RDS Postgres", { row: 3, col: 0, color: "aws-database" });const s3 = d.addBox("S3 Bucket", { row: 3, col: 2, color: "aws-storage" });
d.connect(route53, alb, "DNS");d.connect(alb, ecs1, "traffic");d.connect(alb, ecs2, "traffic");d.connect(ecs1, rds, "queries");d.connect(ecs2, s3, "objects");
d.addGroup("VPC", [alb, ecs1, ecs2, rds, s3]);
return d.render();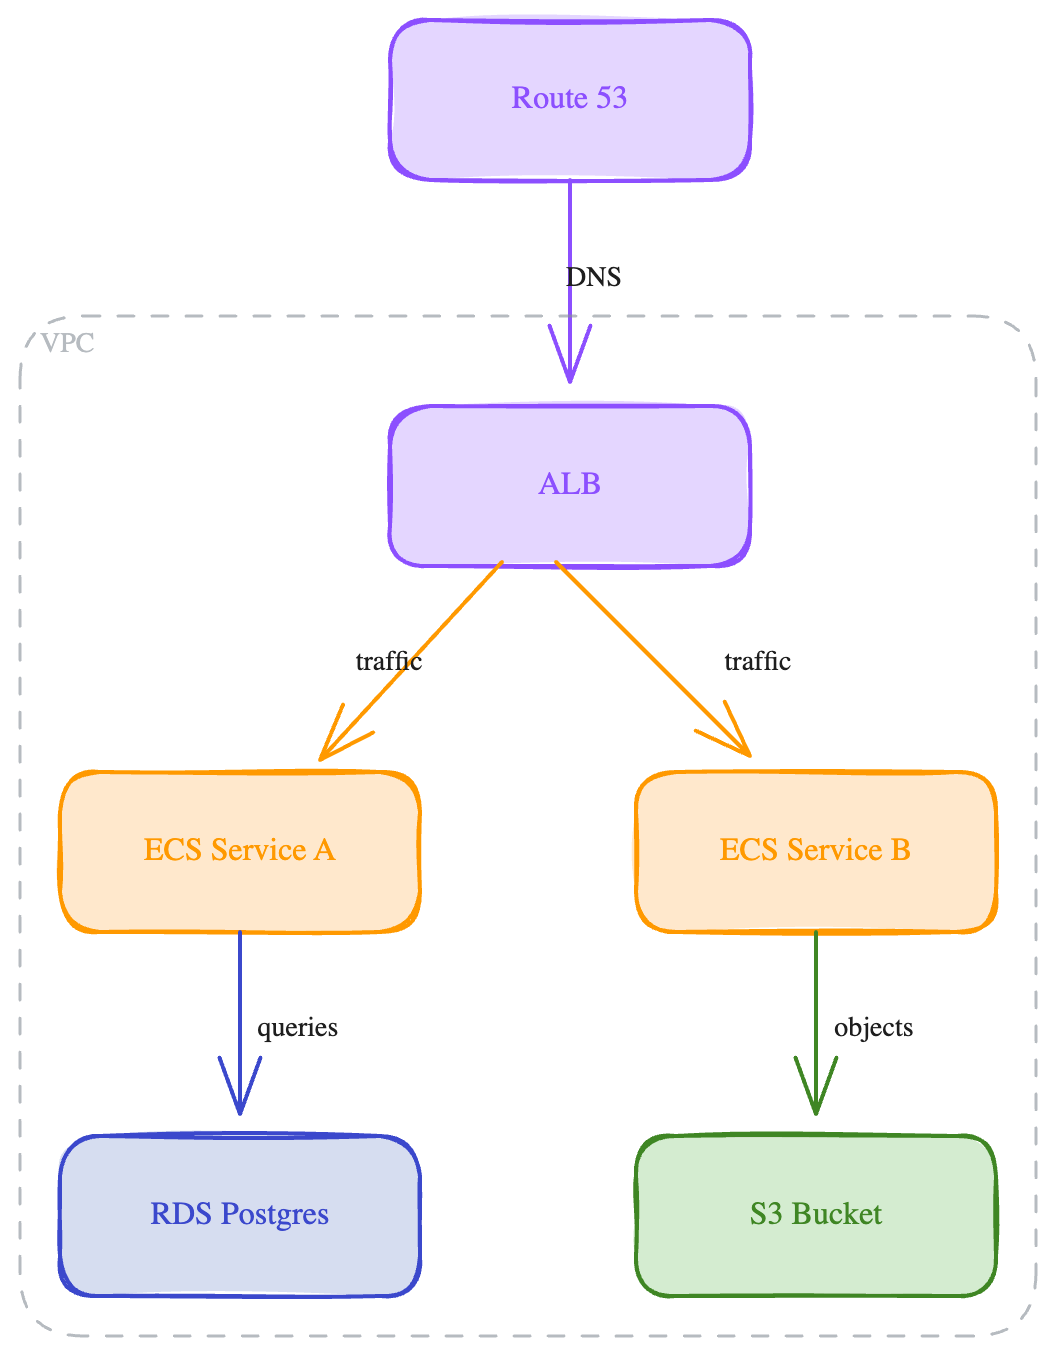
Data Pipeline
Section titled “Data Pipeline”A left-to-right streaming data pipeline from Kafka through Flink to ClickHouse and Grafana. Uses direction: "LR" for horizontal flow.
const d = new Diagram({ direction: "LR" });const kafka = d.addBox("Kafka", { row: 0, col: 0, color: "queue" });const flink = d.addBox("Flink", { row: 0, col: 1, color: "backend" });const clickhouse = d.addBox("ClickHouse", { row: 0, col: 2, color: "database" });const grafana = d.addBox("Grafana", { row: 0, col: 3, color: "frontend" });
d.connect(kafka, flink, "stream");d.connect(flink, clickhouse, "write");d.connect(clickhouse, grafana, "query");
return d.render();
Sequence Diagram
Section titled “Sequence Diagram”A login flow sequence diagram using addActor() and message(). drawmode automatically renders lifelines and message arrows.
const d = new Diagram({ type: "sequence" });const client = d.addActor("Client");const api = d.addActor("API Server");const db = d.addActor("Database");
d.message(client, api, "POST /login");d.message(api, db, "SELECT user");d.message(db, api, "user record");d.message(api, client, "JWT token");
return d.render();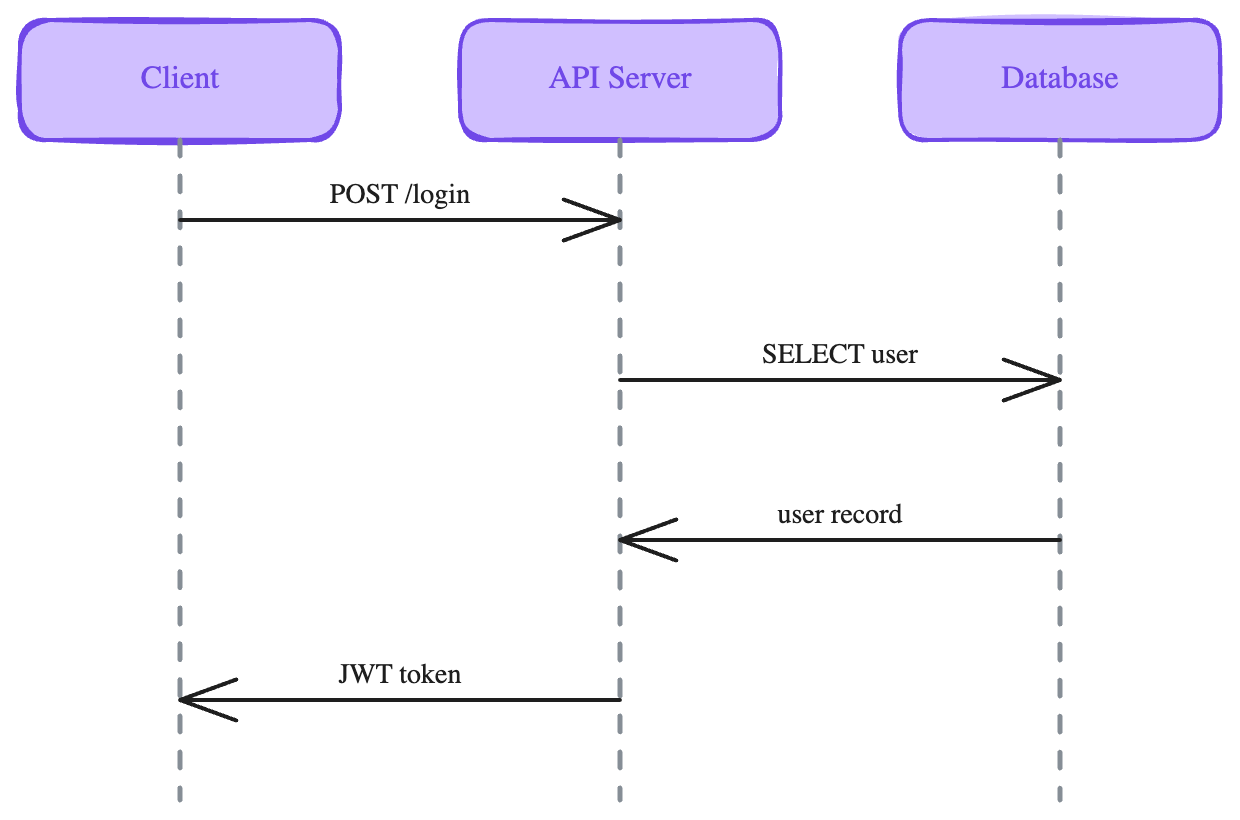
CI/CD Pipeline
Section titled “CI/CD Pipeline”A left-to-right CI/CD pipeline from GitHub through build, test, staging, to production. Each stage uses a different color to indicate its role.
const d = new Diagram({ direction: "LR" });const github = d.addBox("GitHub", { row: 0, col: 0, color: "external" });const build = d.addBox("Build", { row: 0, col: 1, color: "backend" });const test = d.addBox("Test", { row: 0, col: 2, color: "ai" });const staging = d.addBox("Staging", { row: 0, col: 3, color: "cache" });const prod = d.addBox("Production", { row: 0, col: 4, color: "database" });
d.connect(github, build, "push");d.connect(build, test, "artifacts");d.connect(test, staging, "deploy");d.connect(staging, prod, "promote");
return d.render();
Flowchart with Decision Diamond
Section titled “Flowchart with Decision Diamond”A request processing flowchart using addDiamond for a decision node, addEllipse for start/end terminals, and addBox for process steps. Demonstrates mixed shape types in a single diagram.
const d = new Diagram();const start = d.addEllipse("Start", { row: 0, col: 1, color: "users" });const input = d.addBox("Receive Request", { row: 1, col: 1, color: "backend" });const valid = d.addDiamond("Valid?", { row: 2, col: 1, color: "orchestration" });const process = d.addBox("Process Order", { row: 3, col: 0, color: "backend" });const reject = d.addBox("Return Error", { row: 3, col: 2, color: "external" });const save = d.addBox("Save to DB", { row: 4, col: 0, color: "database" });const end = d.addEllipse("End", { row: 5, col: 1, color: "users" });
d.connect(start, input);d.connect(input, valid);d.connect(valid, process, "yes");d.connect(valid, reject, "no");d.connect(process, save);d.connect(save, end);d.connect(reject, end);
return d.render();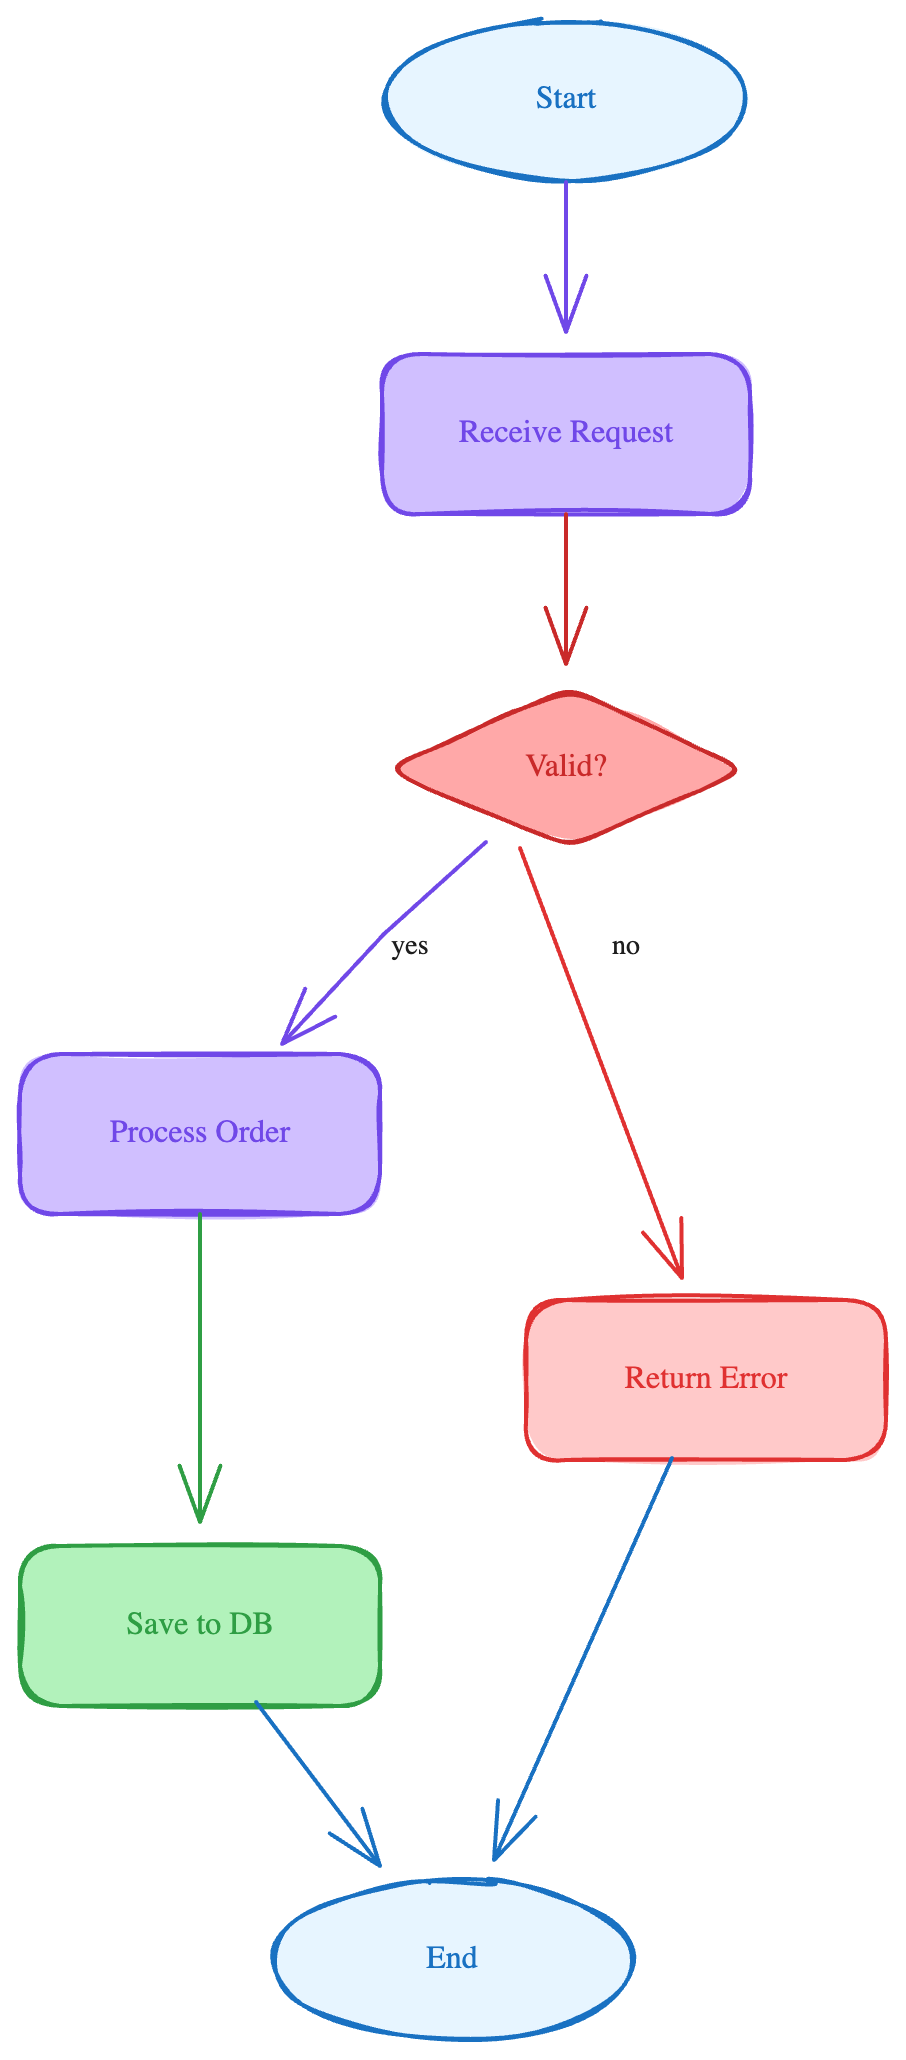
All examples can be regenerated by running npx tsx docs/generate-examples.ts from the project root.